

From the LiveControl dashboard click on Registration from the Reports section:
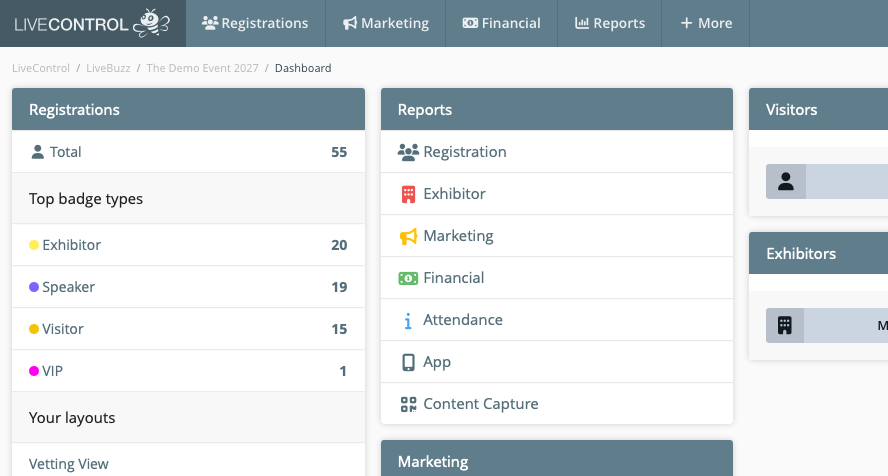 reports > registration
Select Demographic from the blue report tiles:
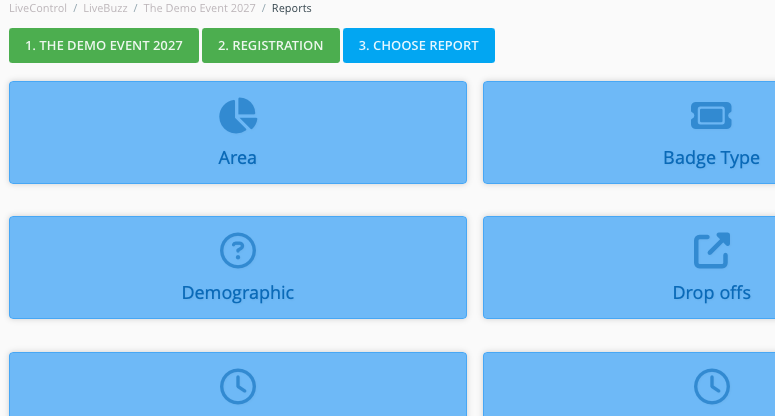 Select Demographic
At the top of the Filter section on the left hand side, choose the demographic question you wish to report on:
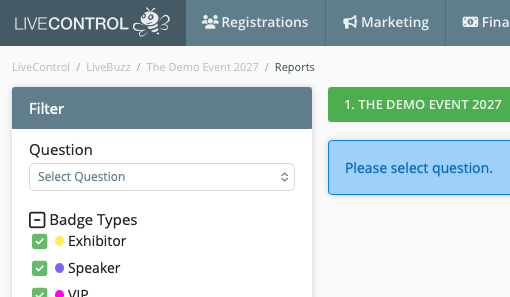
The report will show the data in two different ways, with a chart at the top and as a data table below. Both should show the same numbers.
Charts
Charts can be displayed in 4 different ways, by default the chart is displayed as a bar chart. Using the blue buttons above the chart you can change the way the chart is displayed (Pie, Column, Bar and Area):
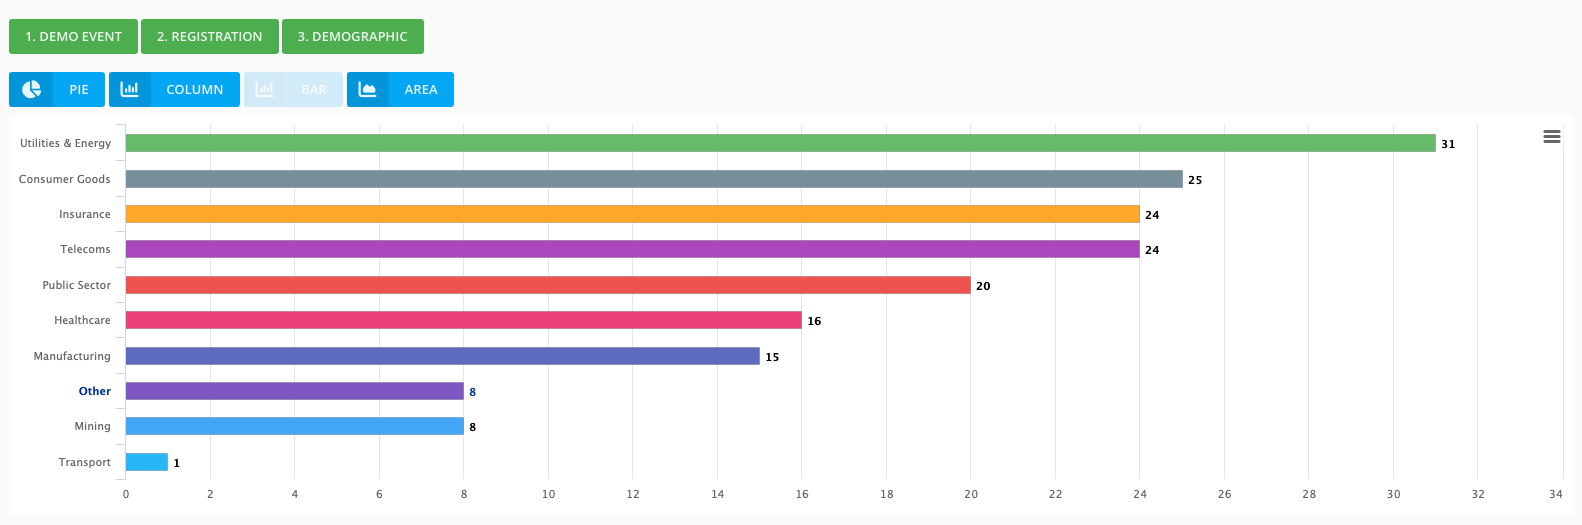 Charts can be displayed in 4 different ways, by default the chart is displayed as a bar chart.
Use the hamburger icon ( ) in the top right hand corner if the chart to export it.
The chart can be exported to .jpg, .png or .svg image or as a .pdf. The chart can also be sent directly to your printer.
Data Table
The data table will show the same numbers as the graph, but also shows an additional column for percentage:
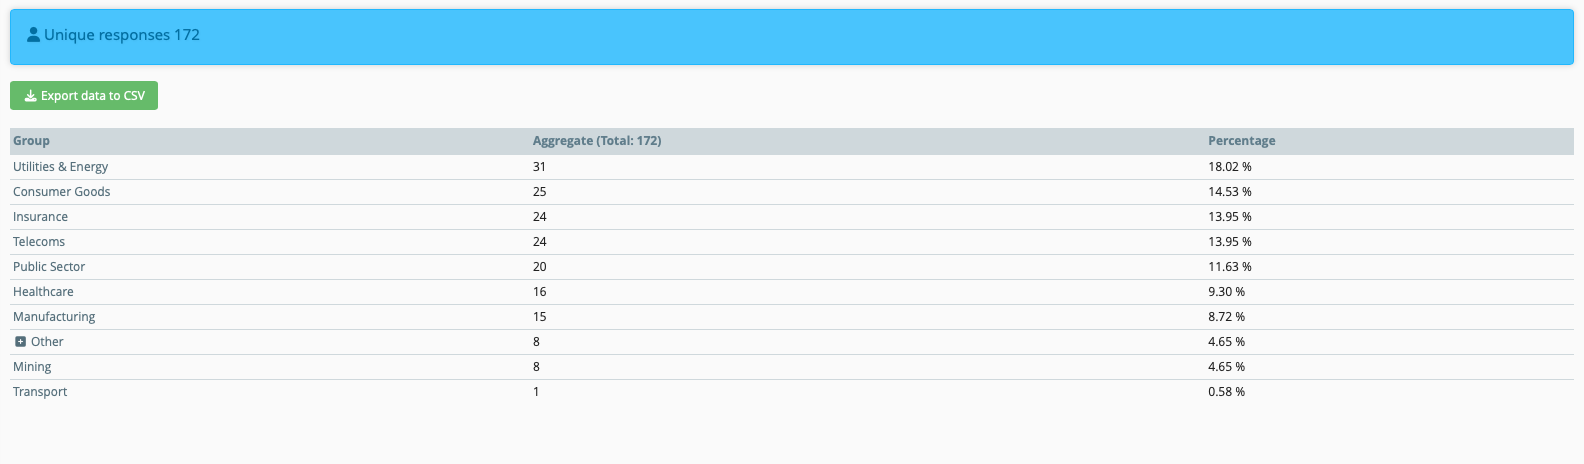 The data table
You can use the Export to CSV button, to download the data table.
Each of the titles in the group column represent an option that was available to the customer during registration. These titles are also links, which will open the customer list and apply the necessary filters to show you the data. This customer data can then be exported.
The data shown in this report can be further filtered using the menu on the left hand side.
Notable filters here include the badge type filter and the attended filter. Everyone preshow will be attended – no, but this will change onsite when their badge is printed / scanned.
If you need any further help with demographic reports, or the filters you want to apply, send us an email to